
19 Evidences
Through the item “EVIDENCES” we can obtain a lot of very useful information on the management of exams, backlogs or to do any specific research.
It is possible to choose between various categories of evidence using the “TABs” above the list. Pay attention that the TABs present are higher than those that can be displayed and therefore it is necessary to use the buttons indicated by the red arrow to scroll through them all.
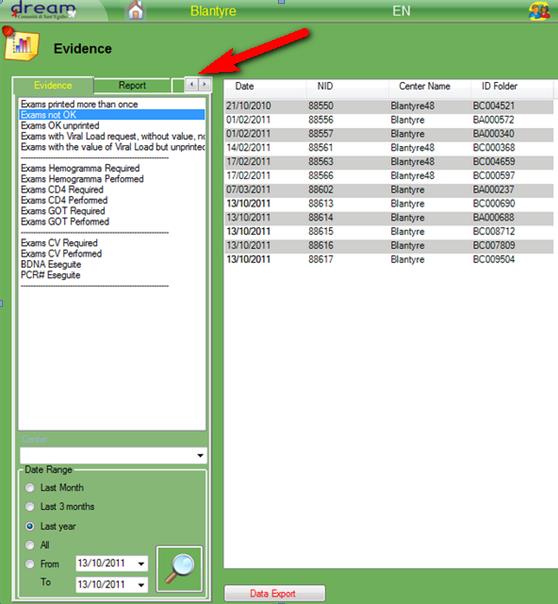
By clicking on the individual items, the list of corresponding results will be displayed on the right. From the results list it is also possible to switch to the exams view and then go back.
In the REPORT section, you can choose the period of interest between 3, 6, 9 or 12 months and a possible reference center to obtain a print preview of the REPORT which can then be printed.
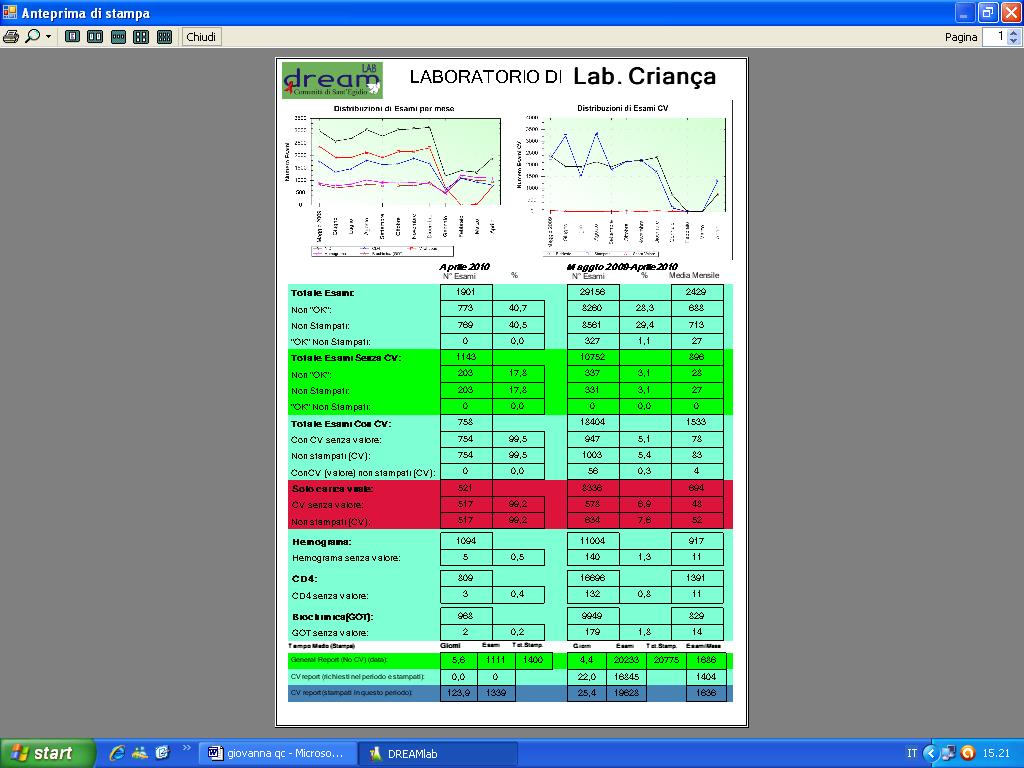
Evidence Report
The report shows the total NIDs based on the requested period.
There are 3 main column details:
Month: Shows the total based in the previous month
Previous month: Shows the total based in the previous month of the column “Month”
Selected Period: Shows the total based in the selected period before to lunch the report (1 month, 6 months , 1 year)
Every column has his own percentage based on the total, and the average for the last period column.
The report shows the NIDs based on the value of the following exams:
Hemogramma, CD4, GOT, GPT, Clicemia, AlfaAmilasi , Creatina, Ferro, BilDir, BilTot, Proteinuria, Albumina, Col Tot, Col HDL, Trigliceridi, Plasmodium, Ferritina, Elettroliti, Viral Load, Tubercolosis.
For every exams are showed the followng data:
Total requested (NID), not processed, validated without valiue, validated with value, not validated, signed, printed.